
Go-go, slow-go, no-go: why retirement spending often falls with age
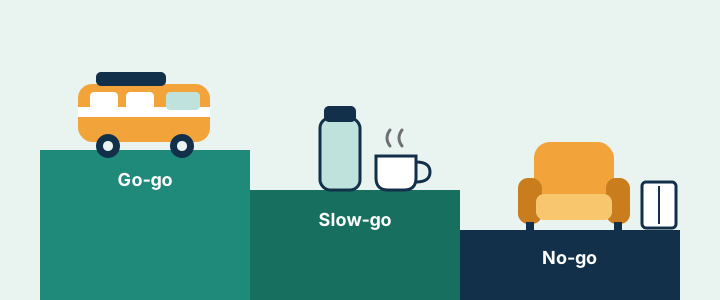
Picture retirement as a three-act play.
Act one: cruises, campervans, finally learning the ukulele, and a garden centre loyalty card that gets a proper workout. Act two: fewer long-haul flights, more long lunches. Act three: a comfy chair, a good book, and strong opinions about the television schedule.
Planners sometimes call these the go-go, slow-go and no-go years. The idea is simple: many people spend more early in retirement and less later on. This guide explains why, what can push the other way, and how the calculator lets you try different shapes.
Why spending often eases off
Nobody's spending is a straight line, but a few things tend to happen as the years go by:
- Travel and big hobbies get smaller. The round-the-world trip becomes a week in Cornwall, then a day trip with a flask.
- Fewer big purchases. The last new car might genuinely be the last new car.
- Home costs often settle. Many people have paid off their mortgage, and households sometimes get smaller.
- Habits change. Less commuting, fewer work clothes, and the discovery that staying in is the new going out.
What the official figures show
The Office for National Statistics surveys thousands of households about what they spend. Here's the average weekly spending for UK households, grouped by the age of the person whose name is on the mortgage or tenancy (the "household reference person"):
| Age | A week in total | Transport | Recreation and culture | Restaurants and hotels |
|---|---|---|---|---|
| 50 to 64 | £687.70 | £110.40 | £87.20 | £51.30 |
| 65 to 74 | £547.10 | £76.60 | £80.80 | £42.50 |
| 75 or over | £444.30 | £49.00 | £55.10 | £28.00 |
ONS Family Spending, UK, April 2022 to March 2025. Age of the household reference person.
Households aged 75 and over spend about a fifth less each week than those aged 65 to 74, and the biggest drops are in getting about, going out and having fun. The flask, it turns out, is a national phenomenon.
A word of caution before anyone frames that table: these are different households at different ages, not the same people followed over time. Older households are smaller on average (1.5 people, against 1.7 for 65 to 74), and grew up with different incomes and habits. So the figures fit the "spending eases off" pattern, but they don't prove that any one person's spending will follow it.
Figures are three-year averages for April 2022 to March 2025, from ONS Family Spending tables A14 to A16, correct as at 11 June 2026.
What can push the other way
The three-act play has some plot twists:
- Care costs. Help at home or a care home can be expensive, and those costs tend to come late. This is the big one.
- Home repairs. Roofs don't care how old you are.
- Helping family. Grandchildren are delightful and, in financial terms, a bottomless pit of trainers.
- Health. Some costs rise with age even when travel falls.
So "spending falls with age" is a common pattern, not a promise. For some people it stays flat; for others it rises at the end.
How the calculator models it
The calculator lets you choose a spending shape. These are illustrations of different patterns, not predictions, and none is the right one:
Worked example: The "Ease off with age" shape
Spending is a percentage of the income you ask for, by age (the older partner's age, for couples):
- From retirement to 74: 100%
- From 75 to 84: 80%
- From 85 onwards: 70%
So if you ask for £24,000 a year, the calculator plans for £24,000 until 74, then 80% of that from 75, and 70% from 85, all in today's money.
The other shapes are Steady, where spending stays the same in today's money for life, and More while active, which front-loads spending in the early years. You can also draw your own.
Why does the shape matter so much? Because a plan that spends a little less later can afford a little more now, and vice versa. It's a seesaw. The shape you pick changes how long the money lasts and how much income the calculator shows you could have.
A word about inflation
All of this is in today's money. A flat line in today's money still means spending more pounds each year as prices rise. "Spending falls" here means real spending: what the money actually buys.
Try it yourself
Compare the shapes with the same pot and see how the answer changes:
- Ease off with age, £250,000 pot, retiring at 65
- Steady spending, same plan
- More while active, same plan
Then think about which shape sounds most like the retirement you picture. Ukulele optional.
The short version
Many people spend more in their active early retirement years and less later, but care costs, repairs and family can push the other way. The calculator offers several spending shapes so you can see how each one changes the picture. None of them is right or wrong; they're different stories.
For free, impartial guidance, MoneyHelper has tools for budgeting in retirement, and the PLSA's Retirement Living Standards describe what different lifestyles might cost.
Sources
- Office for National Statistics, Family spending in the UK (financial year ending 2025, released 11 June 2026)
- Office for National Statistics, Family spending workbook 2: expenditure by income, tables A14 to A16 (financial years ending 2023 to 2025). Contains public sector information licensed under the Open Government Licence v3.0.
- PLSA, Retirement Living Standards