
How long will £1,000,000 last?
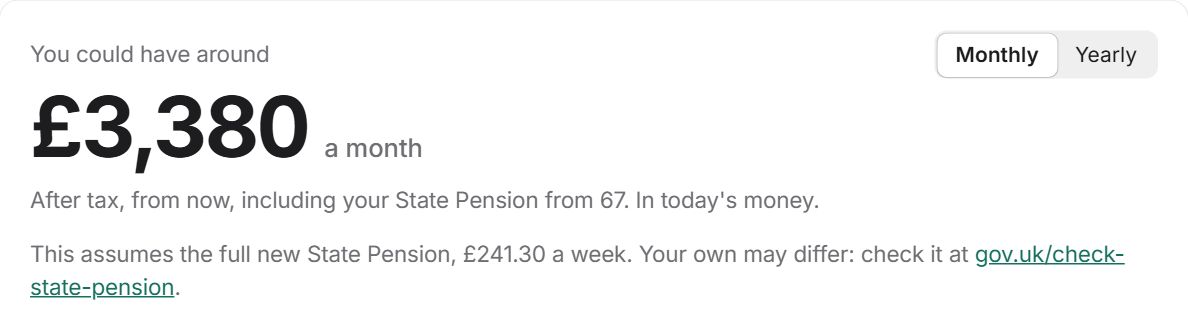
Short answer: around £3,380 a month after tax, from 60, including the full State Pension from 67. That's about £40,560 a year, in today's money, lasting to 91 in 80% of the futures the calculator ran.
Long answer: it depends, annoyingly. Here's what it depends on, using the real calculator rather than a back-of-an-envelope sum.
Open this example in the calculator and change anything you like. Nothing you type leaves your device.
Who's in this example
To get real numbers, we had to invent someone. Our example person is 60, single, lives in England and stops work now. They have £1,000,000 in pensions, invested in a balanced mix, and nothing else saved. The full new State Pension (£241.30 a week) arrives at 67. They take their tax-free cash when they stop work and keep it to spend over time, which is the calculator's starting assumption.
A pot this size does most of the work itself, and the State Pension is a welcome top-up rather than the main course. Tax matters more here: bigger withdrawals mean more of each one is taxed, and some of it at the higher rate. Our drawdown and tax guide explains how that works.
How sure do you want to be?
Markets don't go up by the same amount every year, so the calculator runs 1,000 different futures. Asking for the money to last in more of them gives a lower figure:
| How sure | A month after tax |
|---|---|
| 90% sure | £3,160 |
| 80% sure (the figure above) | £3,380 |
| 50% sure (basically a coin toss) | £3,800 |
The gap between "coin toss" and "90% sure" is £640 a month. Think of it as the price of sleeping well. How sure is sure enough is your call; the calculator lets you pick.
What the money does over time
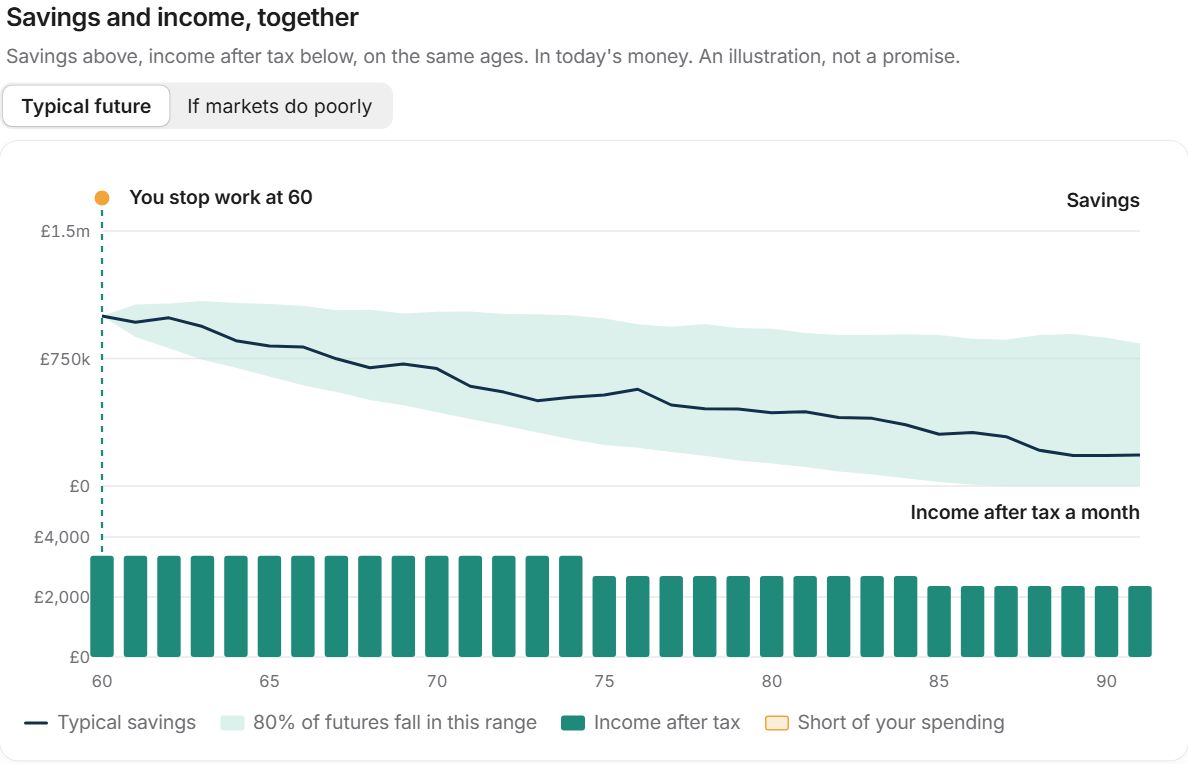
The dark line is the typical future; the green fan is where 80% of futures land. A wide fan isn't the calculator being vague, it's the calculator being honest.
Notice the income steps down at 75 and again at 85. The calculator assumes spending eases off with age, to about 80% of the starting level at 75 and 70% at 85, because that's what the official figures show people actually do. Cruises, then garden centres, then a comfy chair. More in why spending falls with age, and you can switch it off in the calculator.
And if markets sulk?
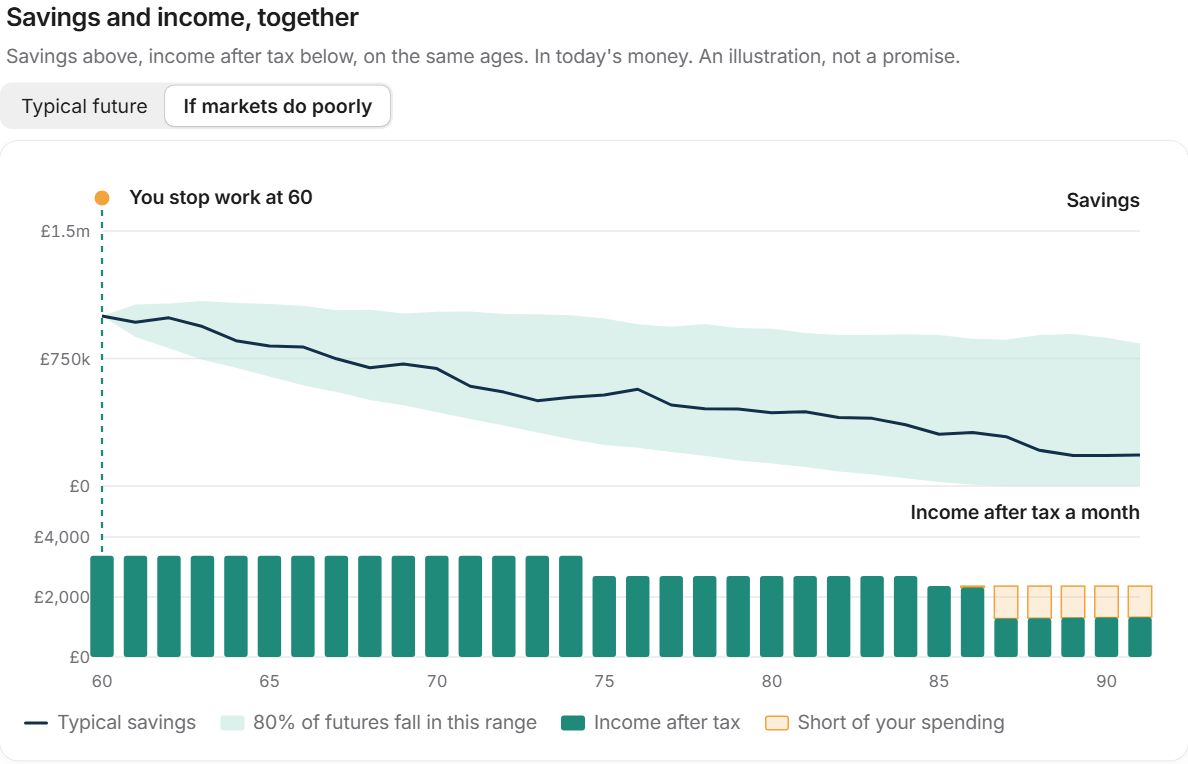
Same person, same plan, but in one of the poorer futures. The orange bits are years where the money doesn't quite cover the planned spending. A bad run of markets early in retirement does more damage than the same bad run later, because you're selling investments while they're down. The jargon is sequence risk; the feeling is "oh no".
What if they worked until 67?
Keep working until 67, so the State Pension starts straight away, and the same £1,000,000 could give around £4,330 a month, £950 more, lasting to 91 in 80% of futures.
That's partly because the pot has fewer years to cover, and partly because there's no seven-year gap to bridge on its own. Nobody's saying work longer; it's just that when you stop matters about as much as how much you've saved. Open the 67 example.
What this example doesn't know about you
- Your actual State Pension. Plenty of people get a bit more or less than the full amount. A free forecast takes five minutes.
- Everything else you have: ISAs, savings, a final salary pension, a partner's pensions.
- Where you live. Scotland taxes income differently.
- Your charges, your investments and your plans, from early retirement to helping the children.
That's what the calculator is for. It's free, it's general information rather than advice, and it never asks for your email address.
Other pot sizes: £750k. Or see every pot size.